SysML Parametric Diagram Tutorial: Calculate Lightning Distance Using Constraint Blocks
SysML Parametric Diagram Tutorial: Calculating Lightning Distance from Thunder Timing
Parametric diagrams are one of the most powerful but often misunderstood features of SysML modeling. They allow engineers to represent mathematical relationships inside system models, enabling simulations, trade studies, and engineering analysis.
In this tutorial, we will build a SysML parametric diagram from scratch that calculates how far away a lightning strike occurred based on the time delay between seeing lightning and hearing thunder.
By the end of this walkthrough, you will understand how to:
-
Create constraint blocks
-
Define mathematical equations
-
Add value properties
-
Connect constraints using binding connectors
-
Run the model in simulation
Watch the full tutorial here:
https://www.youtube.com/watch?v=6l7Vy4nR9E4
Why Use Parametric Diagrams in SysML?
A parametric diagram represents the mathematical relationships between parameters in a system model. These relationships are defined using constraint blocks that contain equations.
Engineers commonly use parametric diagrams for:
-
performance analysis
-
engineering calculations
-
trade studies
-
simulation
-
optimization
Instead of keeping calculations in spreadsheets or external tools, parametric diagrams allow those equations to live directly inside the system architecture model.
Example Problem: Lightning Strike Distance
A common rule of thumb for estimating the distance to a lightning strike is:
Measure the time between seeing lightning and hearing thunder.
Because light travels much faster than sound, the delay corresponds to the distance the sound wave traveled.
In this tutorial, we model that calculation using SysML.
For example:
-
6 seconds delay → approximately 1.25 miles away
-
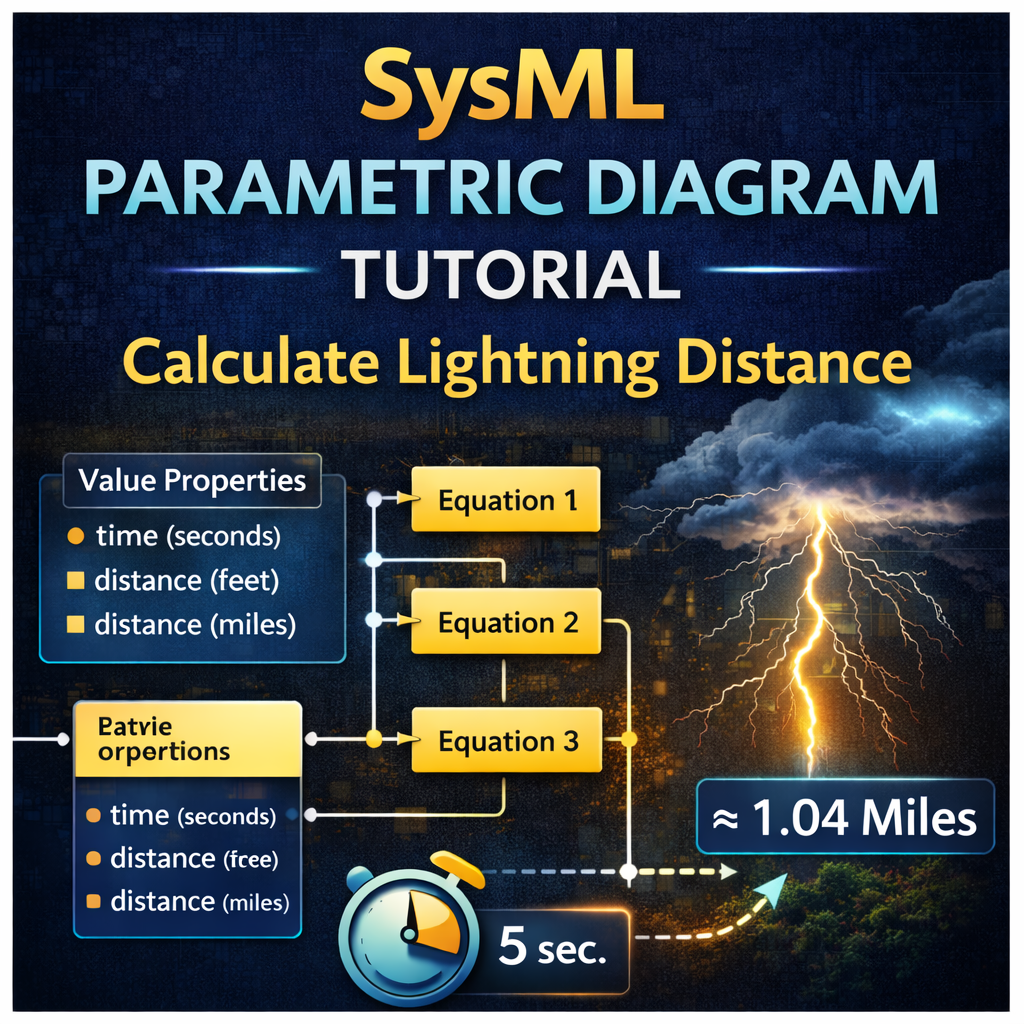
5 seconds delay → approximately 1.04 miles away
The parametric diagram performs this calculation automatically when you run the model.
Step 1: Create Constraint Blocks
The first step is creating constraint blocks that define the mathematical equations used in the calculation.
In this example, the model uses constraints to:
-
Convert time delay into distance in feet
-
Convert feet to miles
-
Chain these equations together to compute the final result
Each constraint block includes a constraint expression, which contains the equation used in the calculation.
For example:
Once the equation is entered, Cameo Systems Modeler can parse the equation and automatically generate the required parameters.
This feature saves time because the parameters appear directly in the containment tree.
Step 2: Organize Constraints in a Package
To keep the model clean and reusable, the constraint blocks are organized into a constraint package.
This package acts as a library of engineering equations that can be reused in different contexts or subsystems.
Good organization of constraint blocks is important for larger models where many equations may exist.
Step 3: Create Example Context Blocks
Next, we create context blocks that will use the constraints.
Two example contexts are created:
-
Example Context 1
-
Example Context 2
Each context represents a system instance where the calculation will run.
The contexts reference the constraint blocks and supply the input parameters required for the equations.
Step 4: Add Constraint Properties
After creating the context blocks, the constraint blocks are dragged into the context as constraint properties.
Each constraint property represents a specific equation instance.
For Example Context 1, three constraint properties are added:
-
Equation 1
-
Equation 2
-
Equation 3
These constraint properties will be connected together to form the complete calculation chain.
Step 5: Create the Parametric Diagram
Now that the structure is ready, we create a parametric diagram inside the context block.
The parametric diagram visually represents the relationships between:
-
constraint properties
-
value properties
-
parameters
At this point, the constraints appear as yellow boxes containing the parameters generated from the equations.
Step 6: Add Value Properties
Next, we add the value properties required by the calculation.
Examples include:
-
time (seconds)
-
distance (feet)
-
distance (miles)
These value properties provide the input and output variables for the constraint equations.
Once added, the value properties can be displayed directly on the diagram.
Step 7: Connect Constraints with Binding Connectors
To make the parametric diagram functional, we connect parameters using binding connectors.
Binding connectors indicate that two parameters represent the same value.
This step essentially links the equations together, allowing outputs from one constraint to become inputs for another.
For example:
This chaining allows the model to perform multi-step calculations.
Running the Simulation
Once the parametric diagram is fully connected, the model can be run in simulation.
For example:
Input:
Output:
The parametric diagram automatically computes the distance using the equations defined in the constraint blocks.
This demonstrates how parametric diagrams allow engineering calculations to execute directly inside the system model.
Alternative Approach: Combining Constraints
The tutorial also demonstrates a second modeling approach.
Instead of separating equations into multiple constraint blocks, all equations can be placed inside a single constraint block.
This approach simplifies the diagram because:
-
fewer constraint properties are required
-
fewer binding connectors are needed
However, the tradeoff is reduced modularity. Separate constraint blocks can often be reused more easily across models.
Both approaches are valid depending on the modeling style and complexity of the system.
Best Practices for SysML Parametric Diagrams
Here are several practical tips when building parametric diagrams.
Keep equations modular when possible
Separate constraint blocks make reuse easier across multiple models.
Use binding connectors carefully
Binding connectors should represent true equality relationships between parameters.
Organize constraints into packages
This keeps engineering equations manageable in large projects.
Use parametric diagrams for analysis
Parametric diagrams are ideal for performance calculations, sizing analysis, and system trade studies.
Why Parametric Diagrams Are Important for Digital Engineering
Parametric diagrams help bridge the gap between:
-
system architecture
-
engineering analysis
Instead of keeping equations separate from the model, parametric diagrams embed them directly within the digital engineering environment.
This enables:
-
executable models
-
automated analysis
-
consistent engineering calculations
-
better traceability between design and performance.
Final Thoughts
Parametric diagrams are one of the most valuable tools in Model-Based Systems Engineering (MBSE). They allow engineers to integrate real engineering calculations directly into system models.
In this tutorial, we built a parametric diagram from scratch that calculates lightning strike distance using:
-
constraint blocks
-
value properties
-
binding connectors
-
simulation
Once you understand these building blocks, you can apply parametric diagrams to far more advanced analyses such as system performance modeling, optimization, and design trade studies.
Watch the full tutorial here: