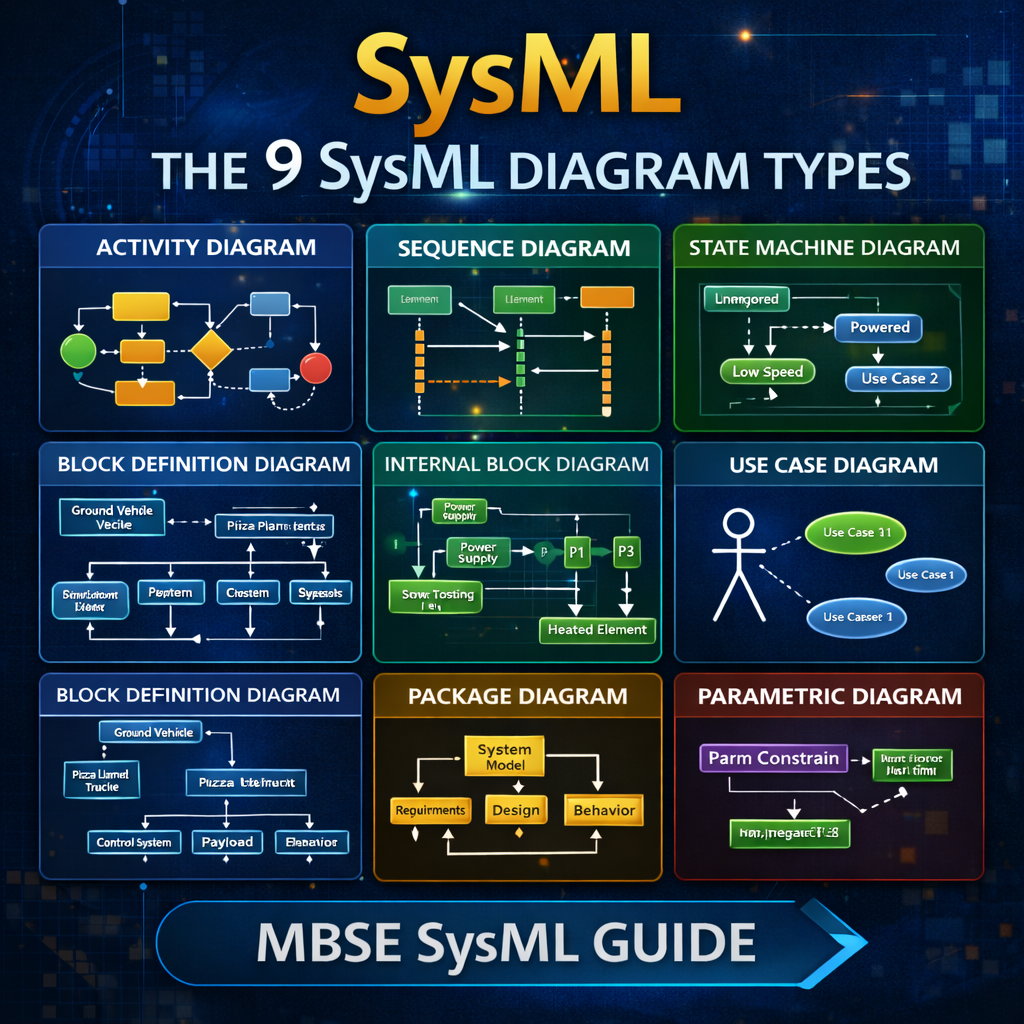
The 9 SysML Diagram Types Explained (With Examples)
The 9 SysML Diagram Types Explained (With Examples)
SysML provides a standardized set of diagrams that allow systems engineers to model system behavior, architecture, and requirements in a structured and traceable way.
In total, SysML includes nine diagram types that fall into three major categories:
-
Behavioral Diagrams
-
Structural Diagrams
-
Requirement Diagrams
Understanding when and why to use each diagram is essential for building effective Model-Based Systems Engineering (MBSE) models.
Watch the full walkthrough here:
https://www.youtube.com/watch?v=09nMFeT5y48
SysML Diagram Categories
SysML diagrams are typically grouped into three categories.
Behavioral Diagrams
These describe how the system behaves over time.
Behavioral diagram types include:
-
Activity Diagram
-
Sequence Diagram
-
State Machine Diagram
-
Use Case Diagram
Structural Diagrams
Structural diagrams describe how the system is constructed and how components relate to one another.
Structural diagram types include:
-
Block Definition Diagram (BDD)
-
Internal Block Diagram (IBD)
-
Package Diagram
-
Parametric Diagram
Requirement Diagram
SysML also includes a dedicated diagram type for managing system requirements and traceability.
Behavioral Diagrams
Behavioral diagrams describe how a system operates and how interactions occur.
Activity Diagram
Activity diagrams model flows of actions and decisions within a system.
They are commonly used to represent:
-
workflows
-
control logic
-
parallel processes
-
system behaviors
An activity diagram contains:
-
actions
-
control flows
-
decision nodes
-
merge nodes
Because of their flexibility, activity diagrams are often the most commonly used behavioral diagram in SysML.
Sequence Diagram
Sequence diagrams focus on time-based interactions between system components.
They display:
-
lifelines representing system elements
-
messages exchanged between components
-
time progression from top to bottom
Sequence diagrams are especially useful when modeling:
-
time-critical operations
-
message-based interactions
-
communication sequences
State Machine Diagram
State machine diagrams represent the different states a system can occupy and how it transitions between them.
For example, an oscillating fan system might include states such as:
-
Unpowered
-
Powered
-
Low Speed
-
Medium Speed
-
Oscillating
-
Static
State machine diagrams are ideal when a system’s behavior depends on operational modes or state transitions.
Use Case Diagram
Use case diagrams are typically created at the beginning of a project.
They help define:
-
what the system should do
-
who interacts with the system
-
the high-level capabilities of the system
A use case diagram includes:
-
actors (users or external systems)
-
use cases
-
system boundaries
These diagrams help teams identify system scope and functional requirements early in development.
Structural Diagrams
Structural diagrams define how a system is built and how its components interact.
Block Definition Diagram (BDD)
The Block Definition Diagram (BDD) is the primary diagram used to describe the structure and taxonomy of a system.
It can show:
-
system decomposition
-
inheritance relationships
-
whole-part relationships
For example, a system might show:
└─ Pizza Planet Delivery Truck
├─ Control System
├─ Payload
├─ Chassis
└─ Propulsion System
BDD diagrams provide the architectural backbone of a SysML model.
Internal Block Diagram (IBD)
The Internal Block Diagram (IBD) shows how parts inside a system connect and communicate.
IBDs typically include:
-
part properties
-
ports
-
connectors
-
item flows
If the BDD defines what components exist, the IBD shows how those components interact internally.
Package Diagram
Package diagrams focus on organizing the model itself, rather than describing the system.
They are commonly used for:
-
structuring the model hierarchy
-
organizing large SysML models
-
creating navigation diagrams
Many SysML tools already expose this structure through the containment tree, but package diagrams can still be useful for presenting model organization.
Parametric Diagram
The Parametric Diagram is a specialized form of the internal block diagram used for mathematical analysis and engineering calculations.
Parametric diagrams connect:
-
value properties
-
constraint blocks
-
mathematical equations
These diagrams are commonly used for:
-
mass roll-ups
-
power budgets
-
performance calculations
-
engineering trade studies
They enable simulation and constraint solving directly within the SysML model.
Requirement Diagram
The Requirement Diagram is used to capture and manage system requirements.
It allows engineers to:
-
decompose requirements
-
trace requirements to system elements
-
verify requirements through analysis or testing
Common relationships include:
-
satisfy
-
refine
-
verify
-
trace
Requirement diagrams help ensure that the system design remains aligned with stakeholder needs.
Abstract Diagram Types in SysML
Some diagram categories in SysML are abstract concepts, meaning they cannot exist as standalone diagrams.
For example:
-
Behavioral Diagram
-
Structural Diagram
-
SysML Diagram
Instead, engineers must create a specific diagram type, such as an activity diagram or internal block diagram.
Summary of the 9 SysML Diagram Types
The nine SysML diagram types are:
Behavioral Diagrams
-
Activity Diagram
-
Sequence Diagram
-
State Machine Diagram
-
Use Case Diagram
Structural Diagrams
-
Block Definition Diagram
-
Internal Block Diagram
-
Package Diagram
-
Parametric Diagram
Requirement Diagram
-
Requirement Diagram
Each diagram type serves a specific purpose in model-based systems engineering workflows.
Final Thoughts
SysML diagrams provide a structured framework for modeling complex systems across behavior, architecture, and requirements.
By combining these nine diagram types, engineers can:
-
define system architecture
-
model system behavior
-
perform engineering analysis
-
maintain traceability between requirements and design
Mastering these diagrams is a key step toward building effective MBSE digital engineering models.